Level 4 — Advanced Market Analysis
Volume profile
5 minute read
Volume at each price
Illustrative example · not live data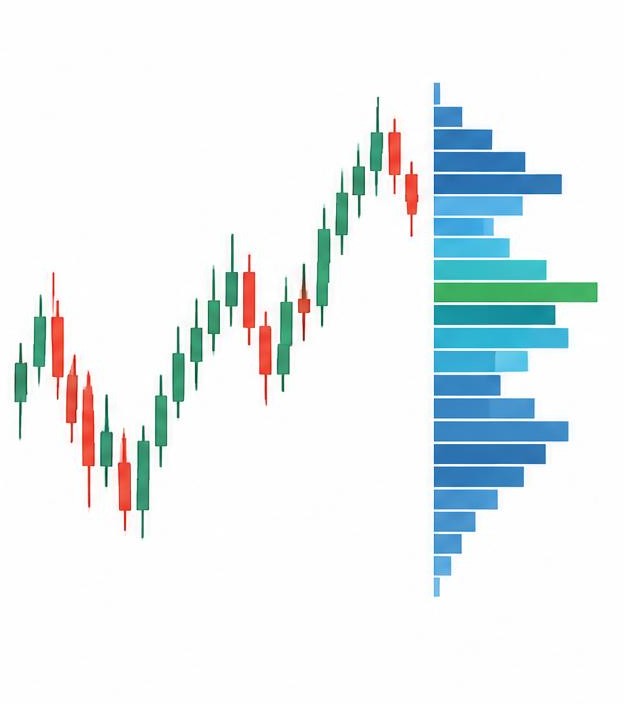
Regular volume bars show how much traded per time period. Volume profile flips it: it shows how much traded at each price level, drawn as horizontal bars along the side of the chart.
Prices where huge volume traded are 'accepted' levels — the market spent real money there, so they tend to act as strong support or resistance. Prices with little volume are 'rejected' — the price tends to move through them quickly.
The price with the most volume of all is called the 'point of control' — the fairest price the market agreed on. Prices often get pulled back towards it.
Volume profile explains why some support levels hold like concrete and others slice through like paper: it's the amount of real trading done there that counts.
Key points to remember
- Volume profile shows volume per price, not per time
- High-volume prices act as strong support/resistance
- Low-volume prices get sliced through quickly
- The point of control is the market's 'fairest' price